Report Builder |

|

|

|

|
|
Report Builder |

|

|

|

|
|
|
||
Report Builder
Please note we will soon be launching our new Report Builder, which will give operators the access to create their own report for their ideal and specific needs. If you wish to sample this new option - please contact Room Manager Support Team for the access link. It is still in Beta stage and we would love your input!
The Advanced Report Builder allows you to create your own reports and run these as you require.
You can build the report that will include as much information as you require, displayed as you wish - from detailed information list to short summary.
You can easily compare to the same period as last year.
All reports can be exported to the file in various formats, including XLS, CSV, JSON, XML and TXT.
Follow the steps below to see how Room Manager Report Builder works:
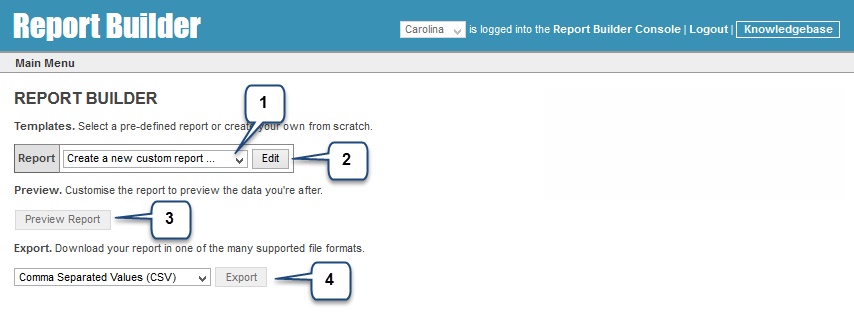
1.From the drop down list select a report you wish to run or choose “Create a new custom report” to create a new one.
2.Click “Edit” to make changes to the report template
3.To run your report click on the “Preview Report” button
4.You can export your report to a file. Select a file type from the drop down list and click “Export” button.
Create a new custom report
From the Reports drop down list select "Create a new custom report" and click Edit button.
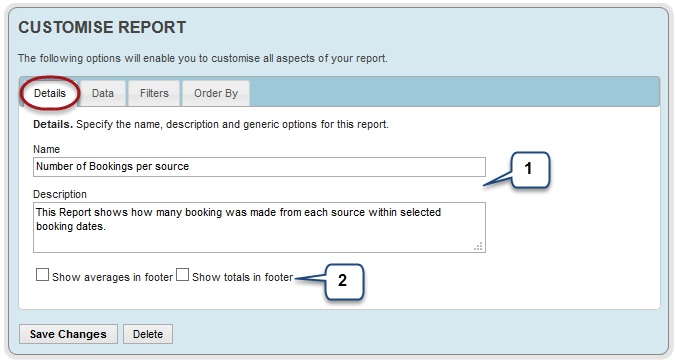
Details – Set basic details for your report
1.Give your Report a name and add a short description (i.e.: to make it easier for your Team to understand what the report contains)
2.Tick those boxes if you wish to add “average” and “total” field at the bottom of your report.
Data – Select what data will be displayed on your report
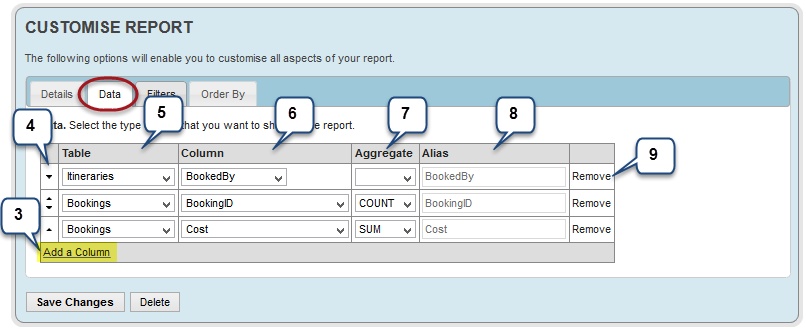
3.Start with clicking on Add a Column link
4.Arrows in the first field allow you to set the order of your columns exactly how you want them appearing in the report
5.Table – Select the type of data you want to retrieve (i.e.: is this information related to Booking details - select Bookings, Guests information- select Guests etc.)
Depending on your selection, the following columns will have different option choices
6.Column – Indicate the actual data you want to show on your report (i.e.: if you selected ‘Guests’ is the Table field – now you can choose between different Guests information: Guest's Name, Country, Email address etc.)
7.Aggregate – Choose the type of calculations that will be performed on the column (COUNT, SUM, AVG, MAX, MIN) or leave it blank to show the actual data (i.e.: to display guest’s name, email address etc.)
8.Alias is an alternate title for your column that will be shown on the report
9.To remove an entry click on ‘Remove’ link
Filters – Apply filters to specify the data that you want included/excluded from the report.
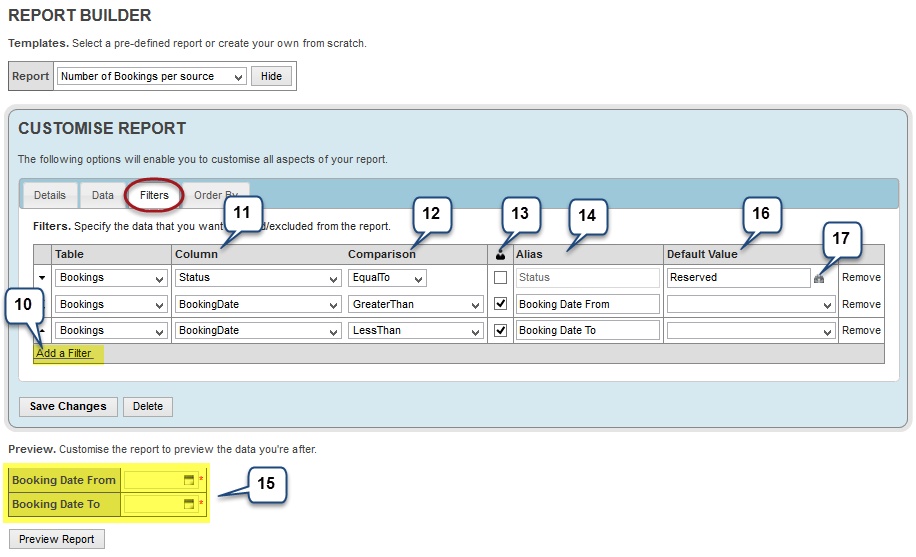
10. To start click on the Add a Filter link
11. Type and Column - select the data you want to filter. Just like in point 4. and 5. – depending your selection the following options may vary
12. Comparison - select the type of comparison you want to make to the data
13. If ticked, the user will be required to fill in this value when running the report. See point 15.
14. Alias - the prompt that will be displayed to the user. Two or more aliases with the same name will be shown to the user as a single input. Edit the Alias to allow multiple inputs.
In our example both filters 2nd and 3rd are applied to the same data (same table and column is selected). For a date range we need two separate input fields (‘Date From’ and ‘Date To’), having 2 different Aliases will ensure that.
15. This is where the input field will appear. Here, the user will choose the booking date rage for the report. Those fields are mandatory.
16. Default Value – the initial value that the user will be presented with (i.e. default date range for the booking date) or, if not user defined, the value that will be compared to the data (in our example only bookings with status ‘Reserved’ will be included in the report)
17. Default Value can be typed in or selected from the list - click on this icon to see the selectable options.
Order By - Specify the order of the data in the report
18. To start setting a data order for your report, click on ‘Add an Order By’ link
19. Choose the column (by selecting Alias) and the order by type
20. Click Save changes button to save your report template
21. Tick this box if you wish to compare the same information from previous periods – choose the drop down list to indicate the period for comparison
22. Click ‘Preview Report’ button to run your report
23. Alternatively you can export your report to a file – select the type of file and click Export button.
24. Your Report will be displayed here
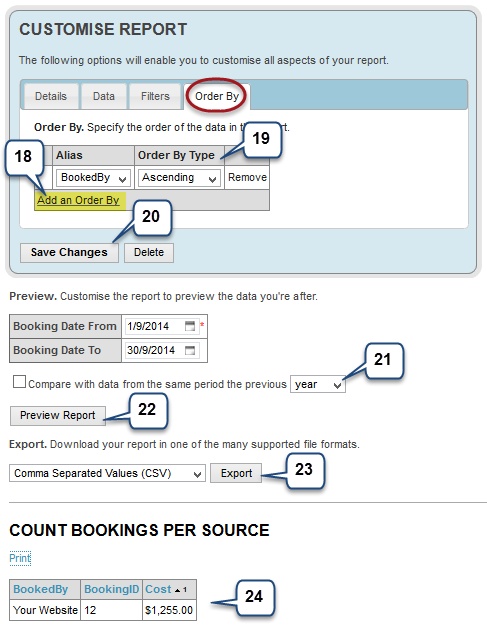
Our example report shows the number of ‘Reserved’ bookings by source made in September, including the total booking cost per source.
In this case – there were only "Your Website" bookings that met the search criteria.